Overview
Your dashboard is the first thing you see when you log into CertLister. It gives you a quick overview of your certificate statistics and trends.
This guide explains what the dashboard shows and how to use it effectively.
Dashboard Layout
Your dashboard has 2 main sections:
- Statistics Cards (top row) – 4 key metrics
- Analytics Charts (bottom row) – 2 trend visualizations
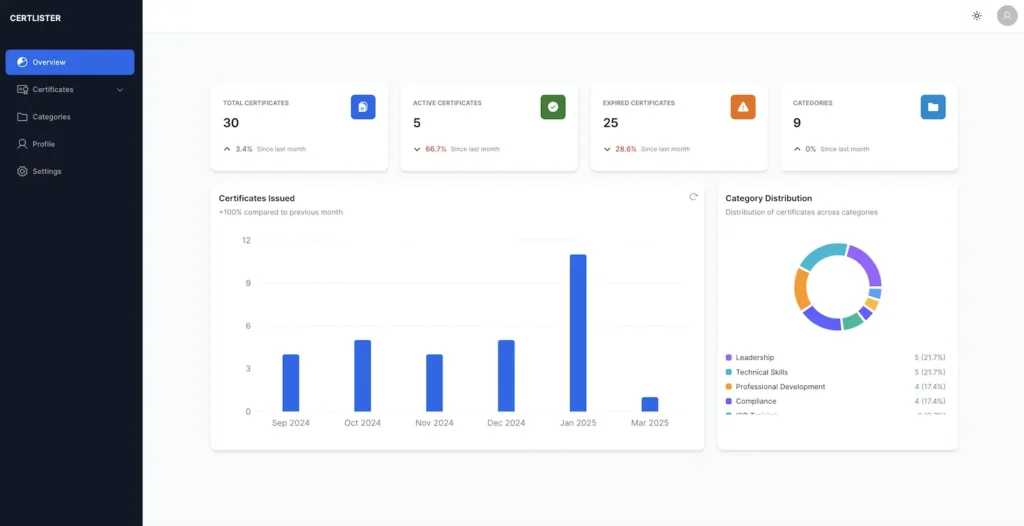
Section 1: Statistics Cards
The top row shows 4 key metrics at a glance. Each card is clickable to view filtered details.
Total Certificates
What it shows:
- Total number of certificates you’ve issued
- All certificates, regardless of status
Example: “125”
What it’s useful for:
- Tracking growth over time
- Knowing your certificate volume
- Monitoring usage against your plan limit (Free tier: 50 certificates)
Click to: View all certificates
Active Certificates
What it shows:
- Certificates that are currently valid
- Excludes expired and revoked certificates
Example: “118”
What it’s useful for:
- Seeing how many valid certificates are in circulation
- Compliance reporting
How it updates:
- Automatically when certificates expire (based on expiry date)
- When you manually revoke certificates
Click to: View only active certificates
Expired Certificates
What it shows:
- Certificates past their expiration date
- Certificates that were active but are no longer valid
Example: “7”
What it’s useful for:
- Identifying certificates that need renewal
- Compliance tracking
- Planning recertification training
Click to: View only expired certificates
Categories
What it shows:
- Total number of certificate categories you’ve created
- Helps organize different types of certifications
Example: “5”
What it’s useful for:
- Tracking how many certificate types you manage
- Deciding if you need to consolidate or add categories
Common categories:
- Safety Training
- Professional Development
- Compliance Certifications
- Technical Skills
Click to: Manage categories
Section 2: Analytics Charts
Two charts provide visual insights into your certificate data.
Certificates Trend Chart
What it shows:
- Line chart showing certificate issuance over time
- Historical trends and patterns
Features:
- Refresh button to update data
- Interactive tooltips on hover
- Time-based visualization
What it’s useful for:
- Seeing growth trends
- Identifying peak issuance periods
- Planning capacity for busy seasons
Category Distribution Chart
What it shows:
- Pie chart showing certificates by category
- Percentage breakdown of certificate types
What it’s useful for:
- Understanding which certificate types are most common
- Balancing training programs
- Resource allocation
Navigating from the Dashboard
Top Navigation Bar
The navigation bar is always visible at the top:
- Dashboard – Returns you to this page
- Certificates – View and manage all certificates
- Categories – Organize certificate types
- Verification – Access public verification and logs
- Settings – Organization settings, profile, billing
User Menu (Top Right)
Click your name or profile icon in the top right corner:
- Profile – Update your name and email
- Settings – Organization and account settings
- Log Out – Sign out of your account
Understanding Certificate Statuses
Certificates on your dashboard have three possible statuses:
Active (Green)
What it means:
- Certificate is currently valid
- Not expired or revoked
- Appears in public verification as valid
Shows as active when:
- No expiration date set
- Expiration date is in the future
Expired (Yellow/Orange)
What it means:
- Expiration date has passed
- No longer valid for compliance
- Shows as “Expired” in public verification
What happens:
- Status automatically changes at midnight on expiration date
- Recipient should renew or recertify
Revoked (Red)
What it means:
- Certificate manually revoked by administrator
- Invalid even if expiration date hasn’t passed
- Shows as “Revoked” in public verification
Common reasons to revoke:
- Fraudulent certificate
- Recipient violated terms
- Certificate issued in error
- Credential suspended
Clickable Stats Cards
Each statistics card is clickable and navigates to a filtered view:
Total Certificates → All Certificates page
Active Certificates → Certificates filtered by “Active” status
Expired Certificates → Certificates filtered by “Expired” status
Categories → Categories management page
Tip: Use these shortcuts to quickly access relevant data instead of manually filtering.
Dashboard Refresh
Dashboard data updates automatically when you:
- Create a new certificate
- Edit a certificate
- Delete a certificate
- Certificate expires (status changes overnight)
Manual refresh:
- Click the refresh icon in the dashboard header
- Or refresh your browser page (F5 or Cmd+R)
Tips for Using Your Dashboard Effectively
Check Daily
Morning routine (2 minutes):
- Review stats – any unexpected changes?
- Look at trend chart – normal issuance pattern?
- Check category distribution – balanced?
Monitor Growth
Weekly task:
- Compare “Total Certificates” to previous week
- Increasing? Your programs are growing
- Plateaued? Consider marketing or new programs
Track Expirations
Monthly task:
- Check “Expired Certificates” count
- Navigate to expired certificates
- Contact holders for renewal
- Plan recertification training
Keep Categories Organized
Quarterly task:
- Review category distribution chart
- Merge similar categories if needed
- Delete unused categories
- Keep it simple (5-15 categories is ideal)
Mobile Dashboard
CertLister works on phones and tablets.
Mobile view differences:
- Statistics stack vertically (one card per row)
- Charts adjust to screen width
- Touch-friendly navigation
Tip: Bookmark app.certlister.com on your phone for quick access.
Troubleshooting
Stats show wrong numbers
Problem: Numbers seem incorrect or outdated.
Solutions:
- Refresh your browser (Ctrl+R or Cmd+R)
- Clear browser cache and cookies
- Log out and log back in
- Wait a few minutes (data may be updating)
“No data to display”
Problem: Dashboard shows empty state.
Reasons:
- You just created your account (no certificates yet)
- All certificates were deleted
- Data is still loading
Solution:
- Create your first certificate
- Wait for data to load completely
- Check your internet connection
Charts not loading
Problem: Statistics cards show but charts are blank.
Reasons:
- Slow internet connection
- Browser compatibility issue
- JavaScript disabled
Solutions:
- Refresh the page
- Try a different browser (Chrome, Firefox, Safari, Edge)
- Check that JavaScript is enabled in browser settings
- Clear browser cache
Stats don’t match certificate count
Problem: Numbers don’t add up (Active + Expired ≠ Total).
Reason: You may have revoked certificates, which are counted in Total but not in Active or Expired.
Solution: This is correct behavior. Total includes all statuses (Active + Expired + Revoked).
What the Dashboard Doesn’t Show
To keep the dashboard focused, some information is not displayed:
Not on dashboard:
- Full list of all certificates (use Certificates page)
- Individual certificate details (click through to view)
- Verification logs (use Verification → Logs)
- Team member activity (if multi-user organization)
- Billing information (use Settings → Billing)
Next Steps
Now that you understand the dashboard, here’s what to do next:
1. Create Your First Certificate
Learn how to issue certificates step-by-step.
→ Read: Create Your First Certificate
2. Set Up Categories
Organize your certificates by type.
3. Explore the Certificates Page
View, search, filter, and export your certificates.
Related Articles
- Create Your Account
- Create Your First Certificate
- Manage Categories
- Quick Start Checklist


