
Reports & Analytics
Time to read: 5 minutes
The Reports page (/reports) gives you a comprehensive view of your organization's credential activity. It surfaces data that is not visible from the Credentials list alone — verification trends, email delivery rates, team security posture, and quota usage.
Navigate to Reports in the left sidebar (between Bulk Generator and Portal Settings).
Overview: Five Tabs
| Tab | What it shows | Plan required |
|---|---|---|
| Verification | Verification counts, trend chart, top verified credentials, activity feed | Basic+ (full data: Pro) |
| Credential Activity | Status breakdown, expiry forecast, category summary | Basic+ |
| Email Delivery | Sent, delivered, bounced, problematic recipients, full email log | Pro |
| Team Activity | Member list, last login, MFA status, security flags | Basic+ (security flags: Pro) |
| Usage | Quota bars for credentials, team, designs, categories, PDFs | All plans |
Tabs you don't have access to show an upgrade prompt rather than being hidden — so you can always see what's available.
Tab 1: Verification Report
Track how often credentials are being verified and by whom.
Summary stats (Basic+)
Four stat cards show at a glance:
- Total Verifications — all-time count
- Last 30 Days — verifications in the past month
- Last 7 Days — verifications in the past week
- Unique Credentials Verified — distinct credentials verified in the last 30 days
Trend chart (Basic+)
An area chart plots verifications per month. Use the date range buttons (3M / 6M / 12M / 2Y / Custom) to zoom in or out. The Custom option lets you pick any date range with month-level pickers.
Top Verified Credentials table (Pro)
A sortable table of your most-verified credentials. Columns: Credential #, Recipient, Title, Category, Verification Count, Last Verified. Paginated 10 / 25 / 50 rows.
Recent Activity Feed (Pro)
The last 100 verification events, newest first. Columns: Credential + Recipient, Verified At, IP address, User Agent (shown as a device-type chip).
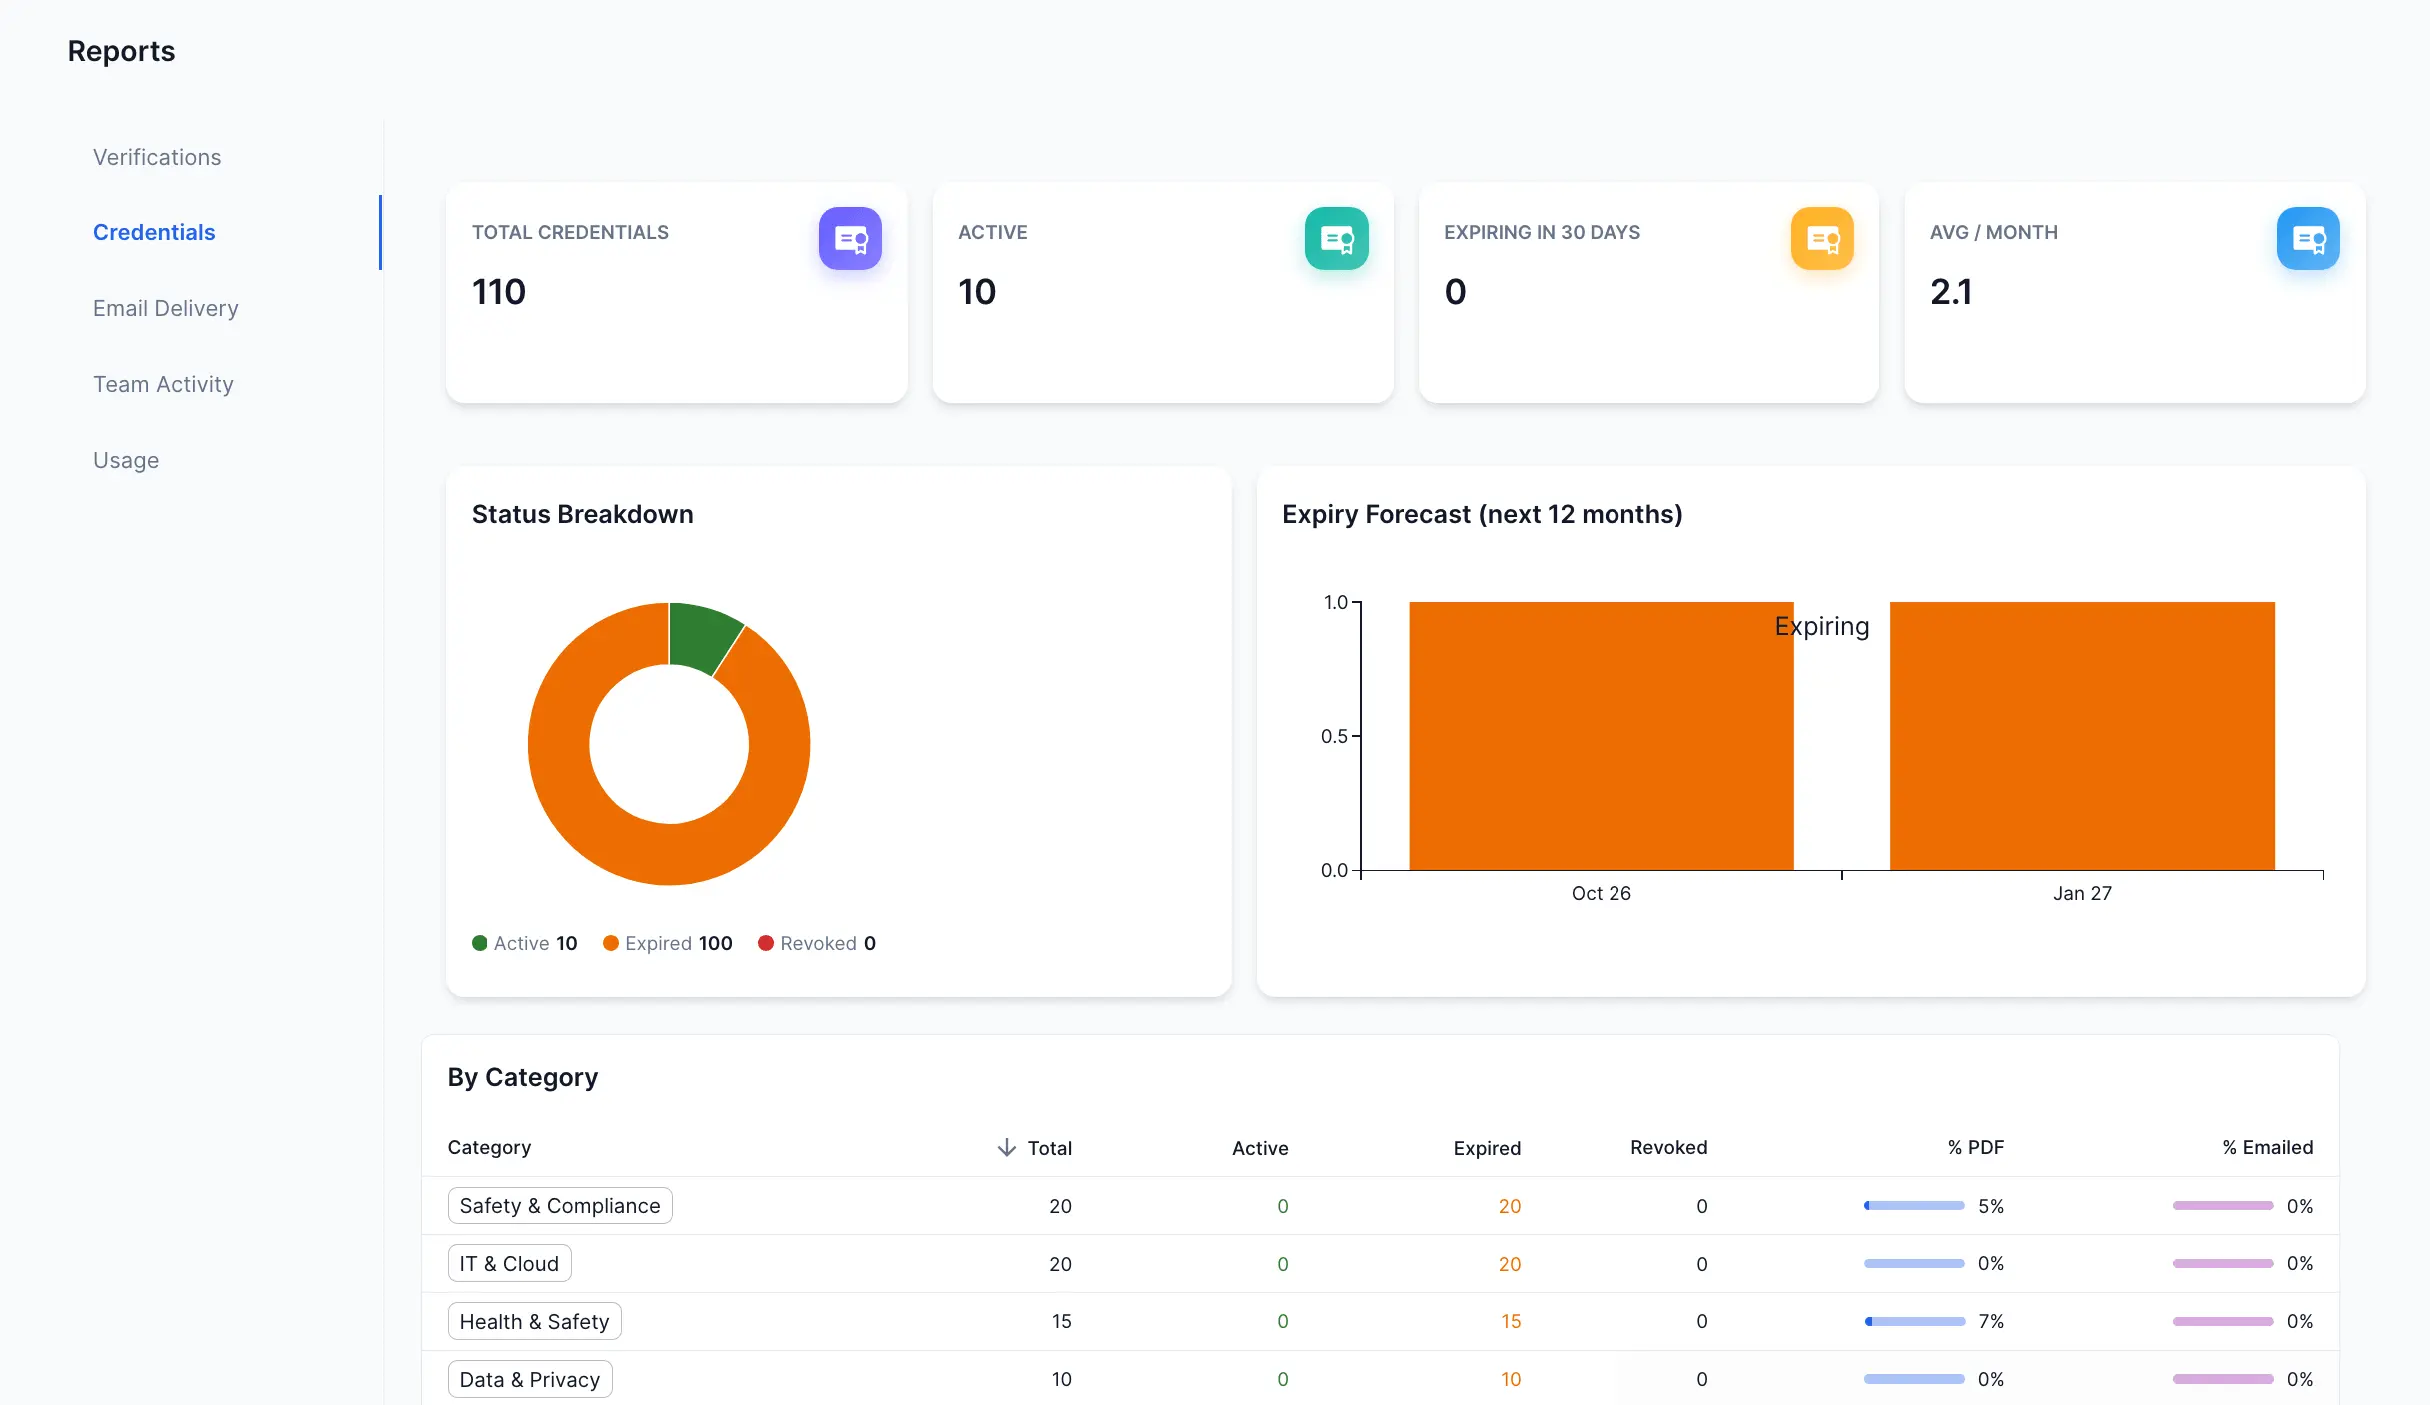
Tab 2: Credential Activity Report
A health check for your credential catalog. Available on Basic and Pro plans.
Summary stats
- Total Credentials — total in your organization
- Active — credentials that are active and not expired
- Expiring (next 30 days) — credentials about to expire
- Avg Issued / Month — average monthly issuance rate since your first credential
Status Donut Chart
A pie chart showing the split between Active, Expired, and Revoked credentials, with an inline legend showing counts.
Expiry Forecast
A bar chart showing how many credentials expire in each of the next 12 months. Use this to plan renewal reminders in advance.
Category Breakdown Table
A table showing, per category: Total, Active, Expired, Revoked, With PDF, and Emailed counts.
Credentials Needing Attention
Two alert sections — Recently Expired (last 30 days) and Expiring Soon (next 30 days) — show individual credentials that need action. Click through to the Credentials page to take action on them.
Tab 3: Email Delivery Report
See exactly what happened after you sent credential emails. Pro plan only.
Summary stats
- Emails Sent — total emails sent with tracked delivery
- Delivered Rate % — percentage that reached the inbox
- Bounce Rate % — percentage that bounced, failed, or were marked as spam; the card turns red when bounce rate exceeds 5%
Note: Open rate and click rate are intentionally not shown. Tracking opens and clicks requires recipient-side tracking pixels, which CertLister does not use. Delivery status (sent / delivered / bounced) is ISP-level and does not require any recipient action.
Event Breakdown Donut + Problematic Recipients
The left column shows a donut chart of delivery events by type (Delivered, Bounced, Failed, Complained, Sent, Delayed). The right column shows a Problematic Recipients table listing any recipient with a bounce, failure, or complaint — including the bounce reason (shown in a tooltip).
If your bounce rate exceeds 5%, an error alert appears above the table to prompt action.
Email Log Table
A full, paginated list of all emails sent to credential recipients. Columns: Recipient name, Email address, Credential (title + number), Category, Status chip, Sent date, Last Update. Paginated at 25 / 50 / 100 rows per page.
Status chip colors:
- Delivered — green
- Bounced / Failed — red
- Complained (spam) — amber
- Delayed — amber
- Sent — grey (no delivery confirmation yet)
Tab 4: Team Activity Report
Monitor your team's access patterns and security posture.
Summary stats (Basic+)
- Total Members — active members in your organization
- Admins — count of admin and super-admin users
- Inactive (90+ days) — members who haven't logged in for 90 or more days
Team Members Table (Basic+)
Lists all active members with: avatar initials, name and email, role chip, last login (shown as relative time — "3 days ago" or "Never"), MFA status chip, and a Locked chip for accounts that are currently locked.
Security Flags (Pro)
Three alert sections appear when applicable:
- Locked accounts — accounts currently locked out (shown as an error alert)
- Users without MFA — members who haven't enabled two-factor authentication (warning)
- Users inactive 90+ days — members who may no longer need access (info)
Use these alerts to periodically audit your team's security posture.
Tab 5: Usage Report
Available on all plans. Shows your current quota consumption across all limits.
Each quota bar displays count / limit (e.g. "47 / 50") with color coding:
- Green — under 75% used
- Amber — 75–90% used
- Red — over 90% used (approaching or at limit)
Quotas shown: Credentials, Team Members, Categories, Saved Designs, PDFs Generated, and Verifications.
Below the bars, your current plan name is shown with Upgrade or Manage Billing buttons.
Troubleshooting
I don't see any data in the Verification tab. Verification data populates from the date your organization's credentials started being verified publicly. If you've never shared your verification portal or widget, there will be no data yet. Try verifying a credential yourself via your public portal to confirm tracking is working.
The Email Delivery tab shows all zeros. Email delivery tracking requires the Pro plan and uses Resend webhooks. If you recently upgraded to Pro, delivery status will populate for emails sent after your upgrade — historical emails sent before do not have delivery data.
The Bounce Rate is over 5%. A high bounce rate usually means some recipient email addresses are invalid. Review the Problematic Recipients table for specific emails, update or remove invalid addresses from your credentials, and avoid re-sending to bounced addresses.
Frequently Asked Questions
Q: How far back does the data go?
A: Verification data goes back to when CertLister began recording logs for your organization. Email delivery data starts from when your Pro subscription was activated. Credential activity data reflects your full catalog.
Q: Can I export report data?
A: At this time, reports are view-only within the app. You can export your full credential list (including email and PDF status columns) from the Credentials page using the CSV export button.
Q: Why does the Verification tab show "No verifications in selected period" even though I know credentials have been verified?
A: Try widening the date range using the 2Y preset or a Custom range. If there is still no data, your organization may have been created before verification logging was activated. Contact support@certlister.com for help.
Q: Which reports are available on the Basic plan?
A: Basic plan gives you the Credential Activity tab (full), the Verification tab (summary stats and trend chart — not the top credentials table or activity feed), the Team Activity tab (member list and stats — not security flags), and the Usage tab. The Email Delivery tab and security flags require Pro.